
Debt Sustainability Under the New EU Fiscal Rules
What if the Commission’s debt models underestimate consolidation costs and overstate growth?
Executive Summary
The EU’s fiscal rules now relies on debt sustainability analyses (DSA) as its central steering tool. Since April 2024, Member States with deficits above 3% of GDP or debt ratios above 60% received a DSA-based reference trajectory from the European Commission. This is a projection of debt-to-GDP up to 17 years into the future, used to define the size and pace of required fiscal consolidation. In this study, we describe how DSA depends on debatable assumptions about growth, interest rates, fiscal multipliers, and other macroeconomic indicators.
The Commission’s assumptions understate the true cost of consolidation. The Commission’s framework fixes the short-run fiscal multiplier at 0.75, assumes output losses from consolidation vanish within three years, and disregards cross-country spillovers when many governments consolidate at once. These simplifications neglect the conditions in which consolidation is most damaging — recessions, expenditure-led adjustments, or simultaneous tightening across trading partners.
More realistic scenarios point to weaker growth and higher debt. Alternatiuve simulations for Germany, France, Italy, and Spain — together nearly three-quarters of euro area GDP — demonstrate that more realist multipliers, slower recovery, or spillovers all reduce growth and leave debt ratios higher than the Commission baseline. In a combined scenario (multiplier 0.9, five-year persistence, with spillovers), debt ratios in 2038 are 3.9 percentage points higher in France and Italy, 3.1 points in Spain, and 1.7 points in Germany.
Adjustment requirements remain sizeable, especially for high-debt countries. Reference trajectories imply annual structural balance improvements of around 1 percentage point of GDP for Italy, France, and Spain under a four-year path. Even with seven-year extensions, the near-term growth drag remains significant.
The risk is that debt paths are too optimistic. If growth effects are stronger or more persistent than assumed, debt ratios may decline more slowly — or even rise temporarily — despite substantial consolidation. This would undermine both economic outcomes and the credibility of the new fiscal framework.
Policy implications
-
Use context-sensitive multipliers. Replace a single multiplier (0.75) with ranges that reflect composition (expenditure vs. revenue), the business cycle (downturns vs. upswings), openness, and monetary conditions.
-
Allow for persistent output losses. Relax the three-year output-gap closure rule where scarring is likely; consider five- to ten-year persistence windows used in the literature.
-
Internalise cross-country spillovers. Incorporate trade-linked spillovers into DSA so national paths reflect partners’ consolidations, especially in the euro area where monetary policy is shared.
-
Sequence and pace consolidation to protect growth. Prefer the seven-year track where macro conditions are weak; front-load lower-multiplier measures and avoid deep expenditure cuts when slack is high.
-
Safeguard growth-enhancing investment. Design adjustment paths that maintain public investment needed for potential growth and resilience, rather than compressing it in the near term.
-
Publish parameters and systematic sensitivity tests. Disclose multiplier, persistence, and spillover settings, and present side-by-side trajectories so policymakers and markets can assess robustness.
-
Coordinate at the euro-area level. Avoid simultaneous, large consolidations that depress aggregate demand and risk raising debt ratios relative to baseline projections; ensure country plans are consistent in the aggregate.
Without these refinements, consolidation paths risk being too ambitious on paper yet counterproductive in practice — delivering weaker growth and less favourable debt trajectories than intended.
1. Introduction
Debt Sustainability Analysis (DSA) plays a key role in reformed EU fiscal rules, which came into force on April 30th 2024. For EU member countries with a fiscal deficit above 3% of GDP or a public debt ratio above 60%, the European Commission (EC) put forward a DSA-based “reference trajectory”. This is supposed to ensure that, by the end of a multi-year fiscal adjustment period, the public debt ratio “is on a plausibly downward trajectory or stays at prudent levels, even under adverse scenarios” (EU Regulation 2024).
This paper provides a quantitative assessment of the assumptions underlying the current DSA in reformed EU fiscal rules (European Commission 2024a).[1] We show how the introduction of different assumptions concerning the impact of fiscal consolidation on economic growth may lead to different outcomes. The fiscal multiplier is a key concept to understand how changes in the fiscal stance may amplify or dampen economic activity (e.g. Batini et al. 2014; Gechert et al. 2016; Ramey 2019). We analyse how changes to the fiscal multiplier assumption in the current DSA framework affect economic outcomes in terms of inflation-adjusted Gross Domestic Product (GDP) and public debt ratios. Furthermore, we highlight the importance of assumptions on how fast the negative short-run growth effects of fiscal adjustment dissipate and whether simultaneous fiscal adjustments in other EU countries magnify the domestic growth impact (e.g. In t‘ Veld 2013; Goujard 2017). When we deviate from the EC’s baseline adjustment scenario by using plausible assumptions on the growth impact of fiscal adjustment based on the existing literature, growth rates turn out lower and public-debt-to-GDP ratios develop more unfavourably.
The rest of the paper is structured as follows. Section 2 introduces the DSA framework and discusses the key assumptions of how fiscal consolidation affects growth and public debt ratios against the background of the relevant academic literature. Section 3 presents different scenarios of how changes to the key assumptions affect DSA outcomes in the four largest euro area countries (Germany, France, Italy, Spain). Section 4 concludes.
2. Key assumptions of the DSA framework in reformed EU fiscal rules against the background of relevant literature
The EC has been applying DSA for years to contribute to the monitoring and surveillance of fiscal policy under the Stability and Growth Pact, to help inform country-specific recommendations in the European Semester, and to support surveillance after adjustment programmes (European Commission 2022, p. 36). However, DSA strongly gains importance with its new role in providing an anchor for bilateral negotiations and surveillance due to reform of EU fiscal rules (Darvas et al. 2023; Heimberger 2023).
Debt sustainability is a complex and contested concept. The literature does not provide a universally accepted definition (e.g. Wyplosz 2011; Guzman 2016). According to reformed EU fiscal rules, debt sustainability is ensured when the public debt ratio is on a plausibly downward trajectory even under adverse assumptions. To operationalize this, the EC applies a baseline scenario, three deterministic stress tests – one in which the structural balance deteriorates compared to the adjustment baseline, one in which the interest-growth differential worsens, and one in which market interest rates increase temporarily – and stochastic analysis, where the latter is used to estimate the probability of a decline in the public debt ratio in the five years after the adjustment period.[2]
The DSA-based criteria for the reference trajectories put forward by the EC for each member state with a fiscal deficit above 3% of GDP or a public debt ratio above 60% require that, without further fiscal consolidation: a) by the end of the multi-year fiscal adjustment period and over the 10 years after the adjustment, the public debt ratio has to decline or stay below the 60% threshold; b) the public debt ratio falls with a sufficiently high probability, which is set to at least 70% (stochastic analysis); and c) the fiscal deficit is brought to below 3% and remains there over the medium term.
The legislative texts do not regulate the DSA assumptions. The application of the DSA was left to the discretion of the EC, which used its existing DSA framework based on the latest Debt Sustainability Monitor (European Commission 2024a) for the first round of “reference trajectories”, submitted to member states in June 2024 but not published. For later rounds, a DSA working group will review the underlying methodology.
An in-depth analysis of all the assumptions in the EC’s DSA framework is beyond the scope of this paper (see European Commission (2024a) and Darvas et al. (2023) for a detailed discussion). Beyond the multi-year fiscal adjustment period, the EC applies a no-fiscal-policy-change assumption, where the only changes considered are due to the costs of ageing as projected in the latest Ageing Report (European Commission 2024b). On borrowing costs and inflation, the EC assumes convergence to financial market expectations. Regarding real GDP growth, the DSA framework relies on the latest EC forecast for the first two years and then, for the following years, it assumes that growth converges to the potential growth rate, estimated via the EC’s potential output model.[3] The EC framework does consider feedback effects of fiscal policy on GDP growth: if there is a fiscal adjustment in a certain year, economic growth in the same year is revised downwards by 0.75 percentage points of GDP for every 1 percentage point in fiscal consolidation (European Commission 2024a, p. 57).
In what follows, we assess the DSA assumptions regarding the impact of fiscal consolidation on growth. In so doing, we hold all other assumptions on interest rates, inflation etc. constant. The European Commission (2024a, p.57) assumes a fiscal multiplier of 0.75 referring to a paper published in its Economic Papers series (Carnot and de Castro, 2015), which presents a new way of measuring the fiscal stance by combining a narrative approach on tax revenues with a structural balance approach on expenditures. The main results are summarised as follows:
“we find point estimates of short-run output multipliers a bit below unity on average, of the order of 0.8-0.9, with a 95% uncertainty range of +-0.3. Fiscal multipliers are known to depend largely on the composition of fiscal shocks and on circumstances…[W]e find… higher expenditure multipliers (of the order of 1.0 or above and up to 1.4) than revenue multipliers (around 0.5 or a bit below)… we find some differentiation between good and bad times as defined by a positive (respectively negative) change in the output gap, with the average multiplier being significantly lower in the former case and the tax and spending multiplier being generally lower as well.” (Carnot and de Castro 2015, p. 4)
Yet, the EC (2024a) does not provide further justification for its assumption on the fiscal multiplier. While 0.75 is a short-run average multiplier below unity, the results reported in Carnot and de Castro (2015) are more nuanced. They suggest that there is considerable uncertainty around point estimates, and that the short-run effect of a fiscal adjustment on growth may vary depending on how much of the adjustment is on the tax or expenditure side, and whether the adjustment is done when there is little or a lot of economic slack. While fiscal multiplier values reported in the literature vary considerably (e.g. Gechert 2015; Leeper et al. 2017), the finding by Carnot and de Castro (2015) that multipliers depend on macroeconomic circumstances is broadly consistent with other papers showing that multipliers in downturns are significantly higher than in upswings, and recession multipliers can be well above unity, in particular on the spending side (e.g. Auerbach and Gorodnichenko 2012; Caldara and Kamps 2017; Canzeroni et al. 2016; Jorda and Taylor 2016; Heimberger 2017; Gechert and Rannenberg 2018). The degree of openness matters too, as fiscal multipliers in small open economies may be substantially lower than in large, relatively closed ones, as much of the change in fiscal policy in open economies spills over into economic activity of trading partners (e.g. Karras 2012; Iltzetzki et al. 2013). Furthermore, the literature argues that it matters whether the central bank is constrained in using its monetary policy tools, as fiscal multipliers can be significantly above unity at the zero-lower bound of nominal interest rates (e.g. Woodford 2011; Bonam et al. 2022). More recent macroeconomic models with heterogeneous agents, bound by precautionary saving motives, tend to find a smaller influence of the monetary policy stance on the multiplier (McKay et al. 2016), but a larger average multiplier effect, which does not peter out quickly, but is more persistent over time (Auclert et al. 2024).
How does the fiscal multiplier affect output over time in the DSA framework? To answer this question, let us assume that a government starts to consolidate in 2025. In the DSA framework, the fiscal adjustment opens up a negative output gap – defined as the difference between actual and potential GDP – in the same year. The size of the output gap is determined by the size of the fiscal adjustment – measured as an improvement in the structural primary fiscal balance, in percentage points of GDP – multiplied by the constant short-run multiplier of 0.75. In the next year (2026), the EC assumes that two thirds of the output gap from the previous year (2025) remain. The fiscal adjustment in 2026 then further increases the output gap based on the short-run fiscal multiplier. This pattern is continued until the adjustment period ends. Let us assume that this happens in 2028, i.e. after a four-year adjustment. The key assumption is that the output gap then closes within three years. For a four-year adjustment period over 2025-2028, the output gap would therefore close automatically over 2029-2031. In the first post-adjustment year (2029), the output gap falls to two thirds of the output gap in the final consolidation year (2028); in the second post-adjustment year (2030), the output gap falls to one third of the 2028 value; and then the gap closes completely in the third post-adjustment year (2031), i.e. actual output returns to potential output.
The EC does not justify its three-year output gap closure rule in any detail. This is particularly interesting since a former European Commission Discussion Paper (Mc Morrow et al. 2017) weighs the arguments in favour or against the then existing t+4-year closure rule (that could be extended to up to t+6 years by expert judgement in the case of a severe downturn). However, the output gap may prove stickier than assumed by the EC, i.e. it may take considerably longer to close the gap and return to potential output (e.g. DeLong and Summers 2012; Jarocinski and Lenza 2018; Auclert et al. 2024)
Finally, a key assumption in the DSA framework in reformed EU fiscal rules is that fiscal adjustment by a given government only affects domestic economic activity, but does not spill over to other countries, even in the presence of strong economic ties. This is an unrealistic assumption, as the EC itself has frequently emphasised the importance of accounting for how the individual fiscal stance affects the euro area aggregate as a whole (e.g. European Commission 2016). No less relevant, fiscal policy spillovers were a main justification for why EU fiscal rules for all member countries were introduced in the first place (e.g. Buti and Giudice 2002). The issue is particularly important in the EMU, as individual euro area countries cannot offset fiscal spillovers by using national monetary policy (e.g. Blanchard et al. 2021). Nonetheless, the EC currently performs the DSA separately for each country, without taking spillovers into account. However, recent empirical findings suggest that cross-country spillovers from fiscal consolidation are sizeable, in particular in the euro area context (e.g. In ‘t Veld 2013; Goujard 2017; Alloza et al, 2019; Poghosyan 2020; Ilori et al., 2022).
3. DSA simulations for the four largest euro area countries
The EC does not make DSA code and data files publicly available. To illustrate the impact of changes in the EC’s assumptions of how fiscal consolidation affects growth, we use a DSA replication. Consistent with Darvas et al. (2024), we use the May 2024 forecast of the EC based on the replication of the relevant DSA framework as outlined in Darvas et al. (2023). The code files for the DSA simulations are freely available (Welslau 2024).[4]
Figure 1 shows the fiscal adjustment requirements for the four largest euro area countries, which account for close to three quarters of euro area GDP. We compare the four-year adjustment according to the reference trajectories with a seven-year adjustment case. Member states can apply for the seven-year adjustment by submitting a set of investments and reforms, which is to be evaluated by the EC – in particular according to whether the measures are growth-enhancing and consistent with debt sustainability. The EC will only grant an extension if it comes to the conclusion that the investments and reforms meet the criteria. The adjustment requirements in terms of the annual improvement in the structural primary balance are 1.08 percentage points of GDP in the four-year case (2025-2028) versus 0.59 percentage points in the seven-year case (2025-2031) for Italy; 0.94 percentage points in the four-year case versus 0.54 percentage points in the seven-year case for France; 0.89 percentage points versus 0.52 percentage points for Spain; and 0.11 percentage points versus 0.02 percentage points for Germany (Darvas et al. 2024).[5] In the reformed EU fiscal rules, the so-called safeguards – which stipulate minimum fiscal adjustment requirements – are only applied if they are stricter than the DSA-based fiscal consolidation criterion. For all the four largest euro area countries, the DSA-based fiscal consolidation requirement binds.[6]
Our simulations focus on the baseline adjustment scenarios of the EC with a four-year period over 2025-2028, after which the structural primary balance is assumed to remain unchanged at the 2028 level. We assume that the fiscal consolidation is implemented by each government according to the requirement to meet EU fiscal rules.
Figure 2 shows DSA simulations for real GDP levels. Figure 3 presents the results for public debt ratios. We compare the EC’s baseline adjustment scenario (in black) with five alternative scenarios. We typically change one assumption at a time to highlight how changes to a single assumption affect the overall results, keeping everything else constant. The only exception is the combined scenario, which uses a combination of plausible assumptions along several dimensions. In what follows, we first discuss the ceteris paribus scenarios and then move to the combined one.
First, the green lines in Figure 2 and Figure 3 assess the impact of a larger average fiscal multiplier of 1.4 – which is the upper range of expenditure multipliers reported in Carnot and de Castro (2014) and broadly consistent with average multipliers for the Euro Crisis (e.g. Heimberger 2017). For all countries except Germany, which does not adjust much domestically to meet reformed EU fiscal rules (see Figure 1), a larger short-run multiplier reduces real GDP compared to the baseline over the course of the adjustment period 2025-2028. However, from 2029 onwards the negative output gap (actual GDP below potential GDP) caused by the fiscal adjustment closes within three years due to the output gap closure rule. Nevertheless, the larger multiplier scenario leads to significantly higher public debt ratios in 2038 than under the baseline: by 4.5 percentage points of GDP in Italy, 3.4 percentage points in France, 3.4 percentage points in Spain, and 0.2 percentage points in Germany.
Second, we assume that the negative short-run growth effects of fiscal adjustment dissipate more slowly, using a five-year output gap closure rule instead of three years (orange lines in Figure 2 and Figure 3). This choice is within the range of the EC’s previous output gap closure rules between four and seven years (Mc Morrow et al. 2017). For France, Italy and Spain – which deliver much larger domestic fiscal adjustments than Germany – we can see that real GDP levels revert more slowly back to the potential GDP path. This implies that public debt ratios turn out somewhat higher – although the differences compared to the EC’s baseline are not as pronounced as in the larger fiscal multiplier scenario. Third, the red lines in Figure 2 and Figure 3 show the impact of assuming an even longer drag of the negative growth effects of fiscal adjustment by setting a ten-year output gap closure. This is motivated by the literature suggesting that it may take at least ten years before hysteresis effects wash out (e.g. DeLong and Summers 2012). Under this scenario, real GDP only reverts back to the potential GDP path by the end of the projection horizon. Hence, public-debt-to-GDP ratios in 2038 turn out significantly higher than under the baseline: by 6.7 percentage points in France, 5.4 percentage points of GDP in Italy, 4.0 percentage points in Spain, and 1.9 percentage points in Germany.
Fourth, we assume that fiscal consolidation by trading partners spills over into domestic economic activity (purple lines). This scenario is coherent with the literature that finds cross-country spillovers of fiscal adjustment, especially in the euro area context (e.g. In ‘t Veld 2013; Poghosyan 2020). We model spillover effects based on GDP-weighted export links with other countries. Hence, a fiscal consolidation in country B affects country A’s real GDP proportional to the share that exports to country B make up in its GDP.[7] If consolidation reduces growth in country B, its import demand is assumed to decline proportionally, which in turn affects real GDP in country A. Because reductions in growth that spill over to other countries in this way are themselves a function of spillovers from all other countries, we iteratively calculate the equilibrium effect of all spillovers.
Due to the negative impact of spillovers on domestic GDP growth, public debt ratios in 2038 are higher than under the EC’s assumptions for all countries: by 0.7 percentage points of GDP in Germany, and by 0.5 percentage points in France, Italy and Spain, respectively. The results suggest that spillovers have a slightly larger impact on Germany, because Germany has strong trade links with many EU countries, including those that have to implement sizeable fiscal adjustments to meet EU fiscal rules. While these findings suggest that spillovers can have an impact, the assumption on a larger fiscal multiplier and a longer output gap closure rule are quantitatively more important for the countries that implement sizeable fiscal adjustments to meet EU fiscal rules at home. Germany is the only country where the spillover assumption has a larger impact on the projected public debt ratio than either in the larger fiscal multiplier scenario and the five-year output gap closure scenario. This is because Germany only has to adjust little domestically to meet EU fiscal rules (see Figure 1).
Finally, the blue lines refer to the combined scenario where we assume: a short-run fiscal multiplier of 0.9, motivated by empirical findings of average multipliers just below unity (e.g. Carnot and de Castro 2015; Gechert 2015); a five-year output gap closure rule, arguably a conservative choice based on the literature pointing to slow dissipation of negative output effects (e.g. DeLong and Summers 2012); and cross-country spillover effects of fiscal adjustment modelled based on the GDP weight in exports (e.g. In ‘t Veld 2013), where we take the same approach as in the previous spillovers scenario. Our assumptions do not involve any extreme choices, as we refrain from assuming multipliers above 1, very slow dissipation of growth effects of fiscal adjustment during downturns, or magnified spillovers due to interactions with domestic growth slumps. The results point to lower real GDP levels during the adjustment period 2025-2028 than under the EC’s baseline assumptions. Although GDP reverts back to the path of potential GDP in 2033 by assumption, the stronger growth drag from fiscal adjustment up to that point leads to significantly higher public debt ratios. Public debt ratios consistently turn out higher than under the adjustment baseline, albeit the difference varies across countries – with 3.9 percentage points in France, 3.9 percentage points in Italy, 3.1 percentage points in Spain, and 1.7 percentage points of GDP in Germany.
Figure 2: DSA simulations of real GDP levels under different assumptions
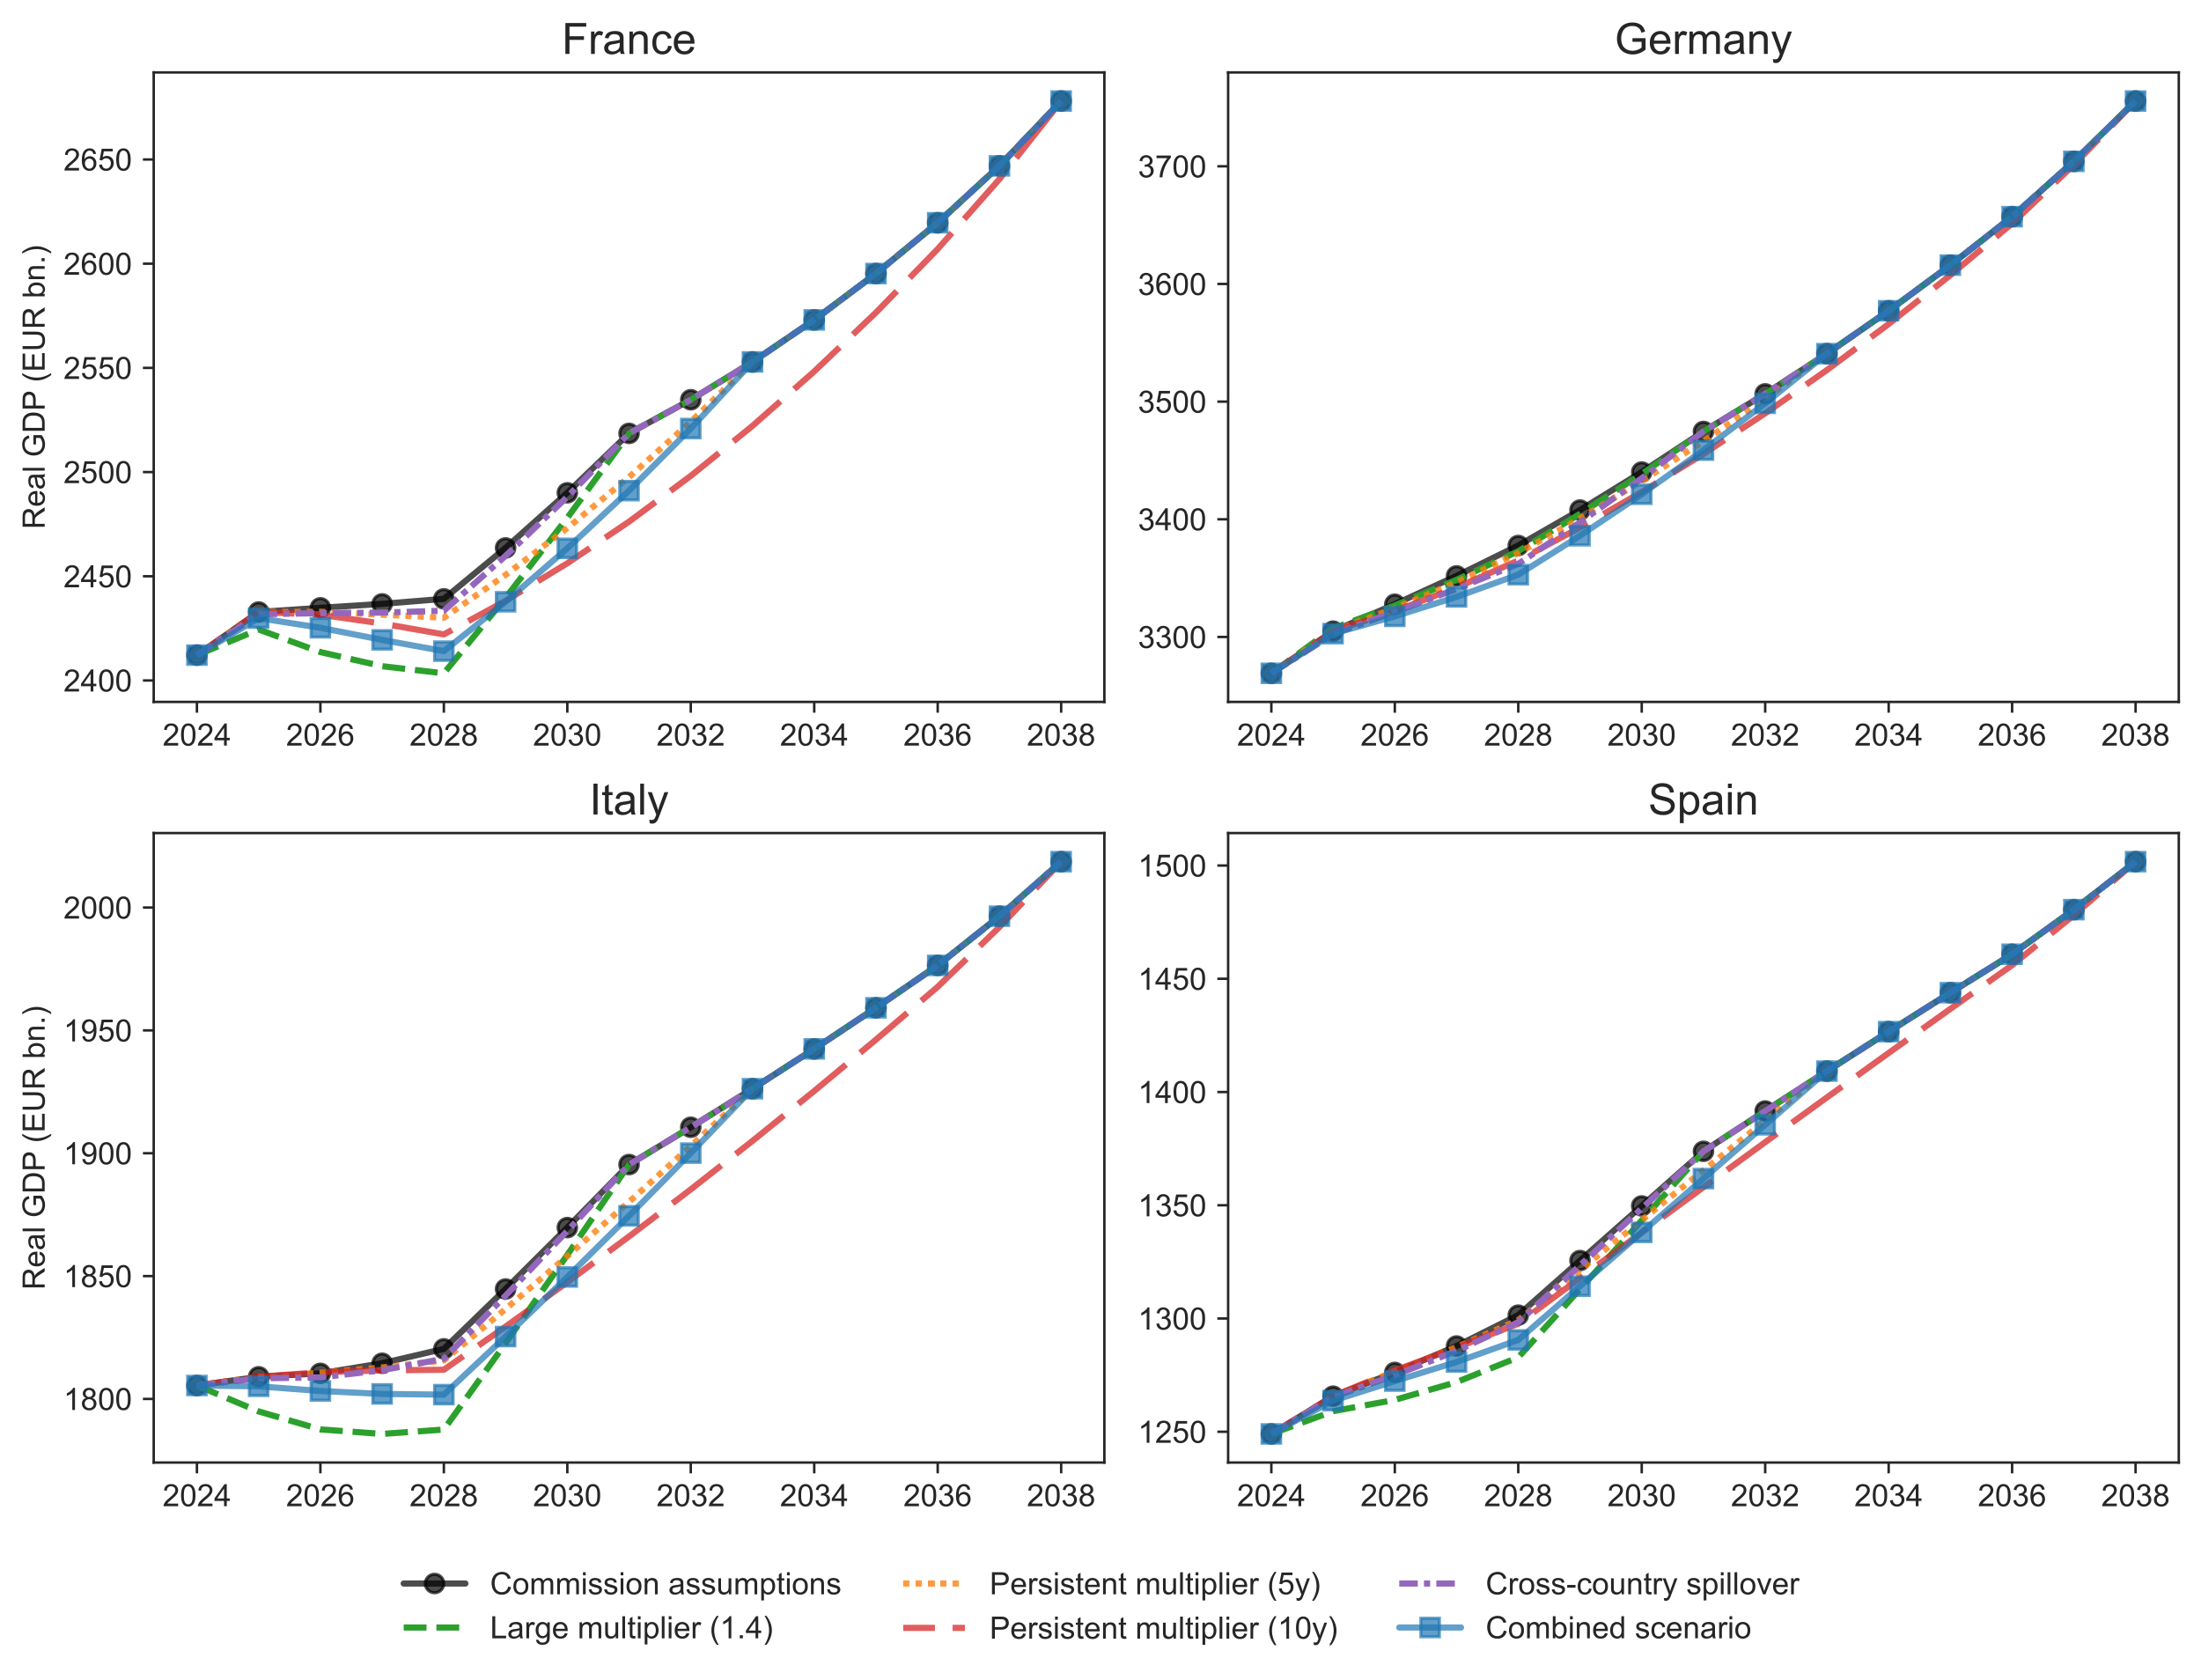
Source: Welslau (2024), European Commission May 2024 forecast; own calculations.
Note: Baseline methodology based on European Commission (2024a) and requirements of the reformed fiscal framework. The large multiplier scenario increases the size of the contemporaneous fiscal multiplier from 0.75 to 1.4. The persistent multiplier scenarios assume linear phase out of contemporaneous multiplier effects over 5 or 10 years instead of the 3-year baseline. The cross-country spillover scenario assumes that consolidation affects trading partner’s real GDP proportional to GDP weighted export shares. The combined scenario features a 0.9 fiscal multiplier, 5-year persistence, and cross-country spillovers.
Figure 3: DSA simulations of public-debt-to-GDP ratios under different assumptions
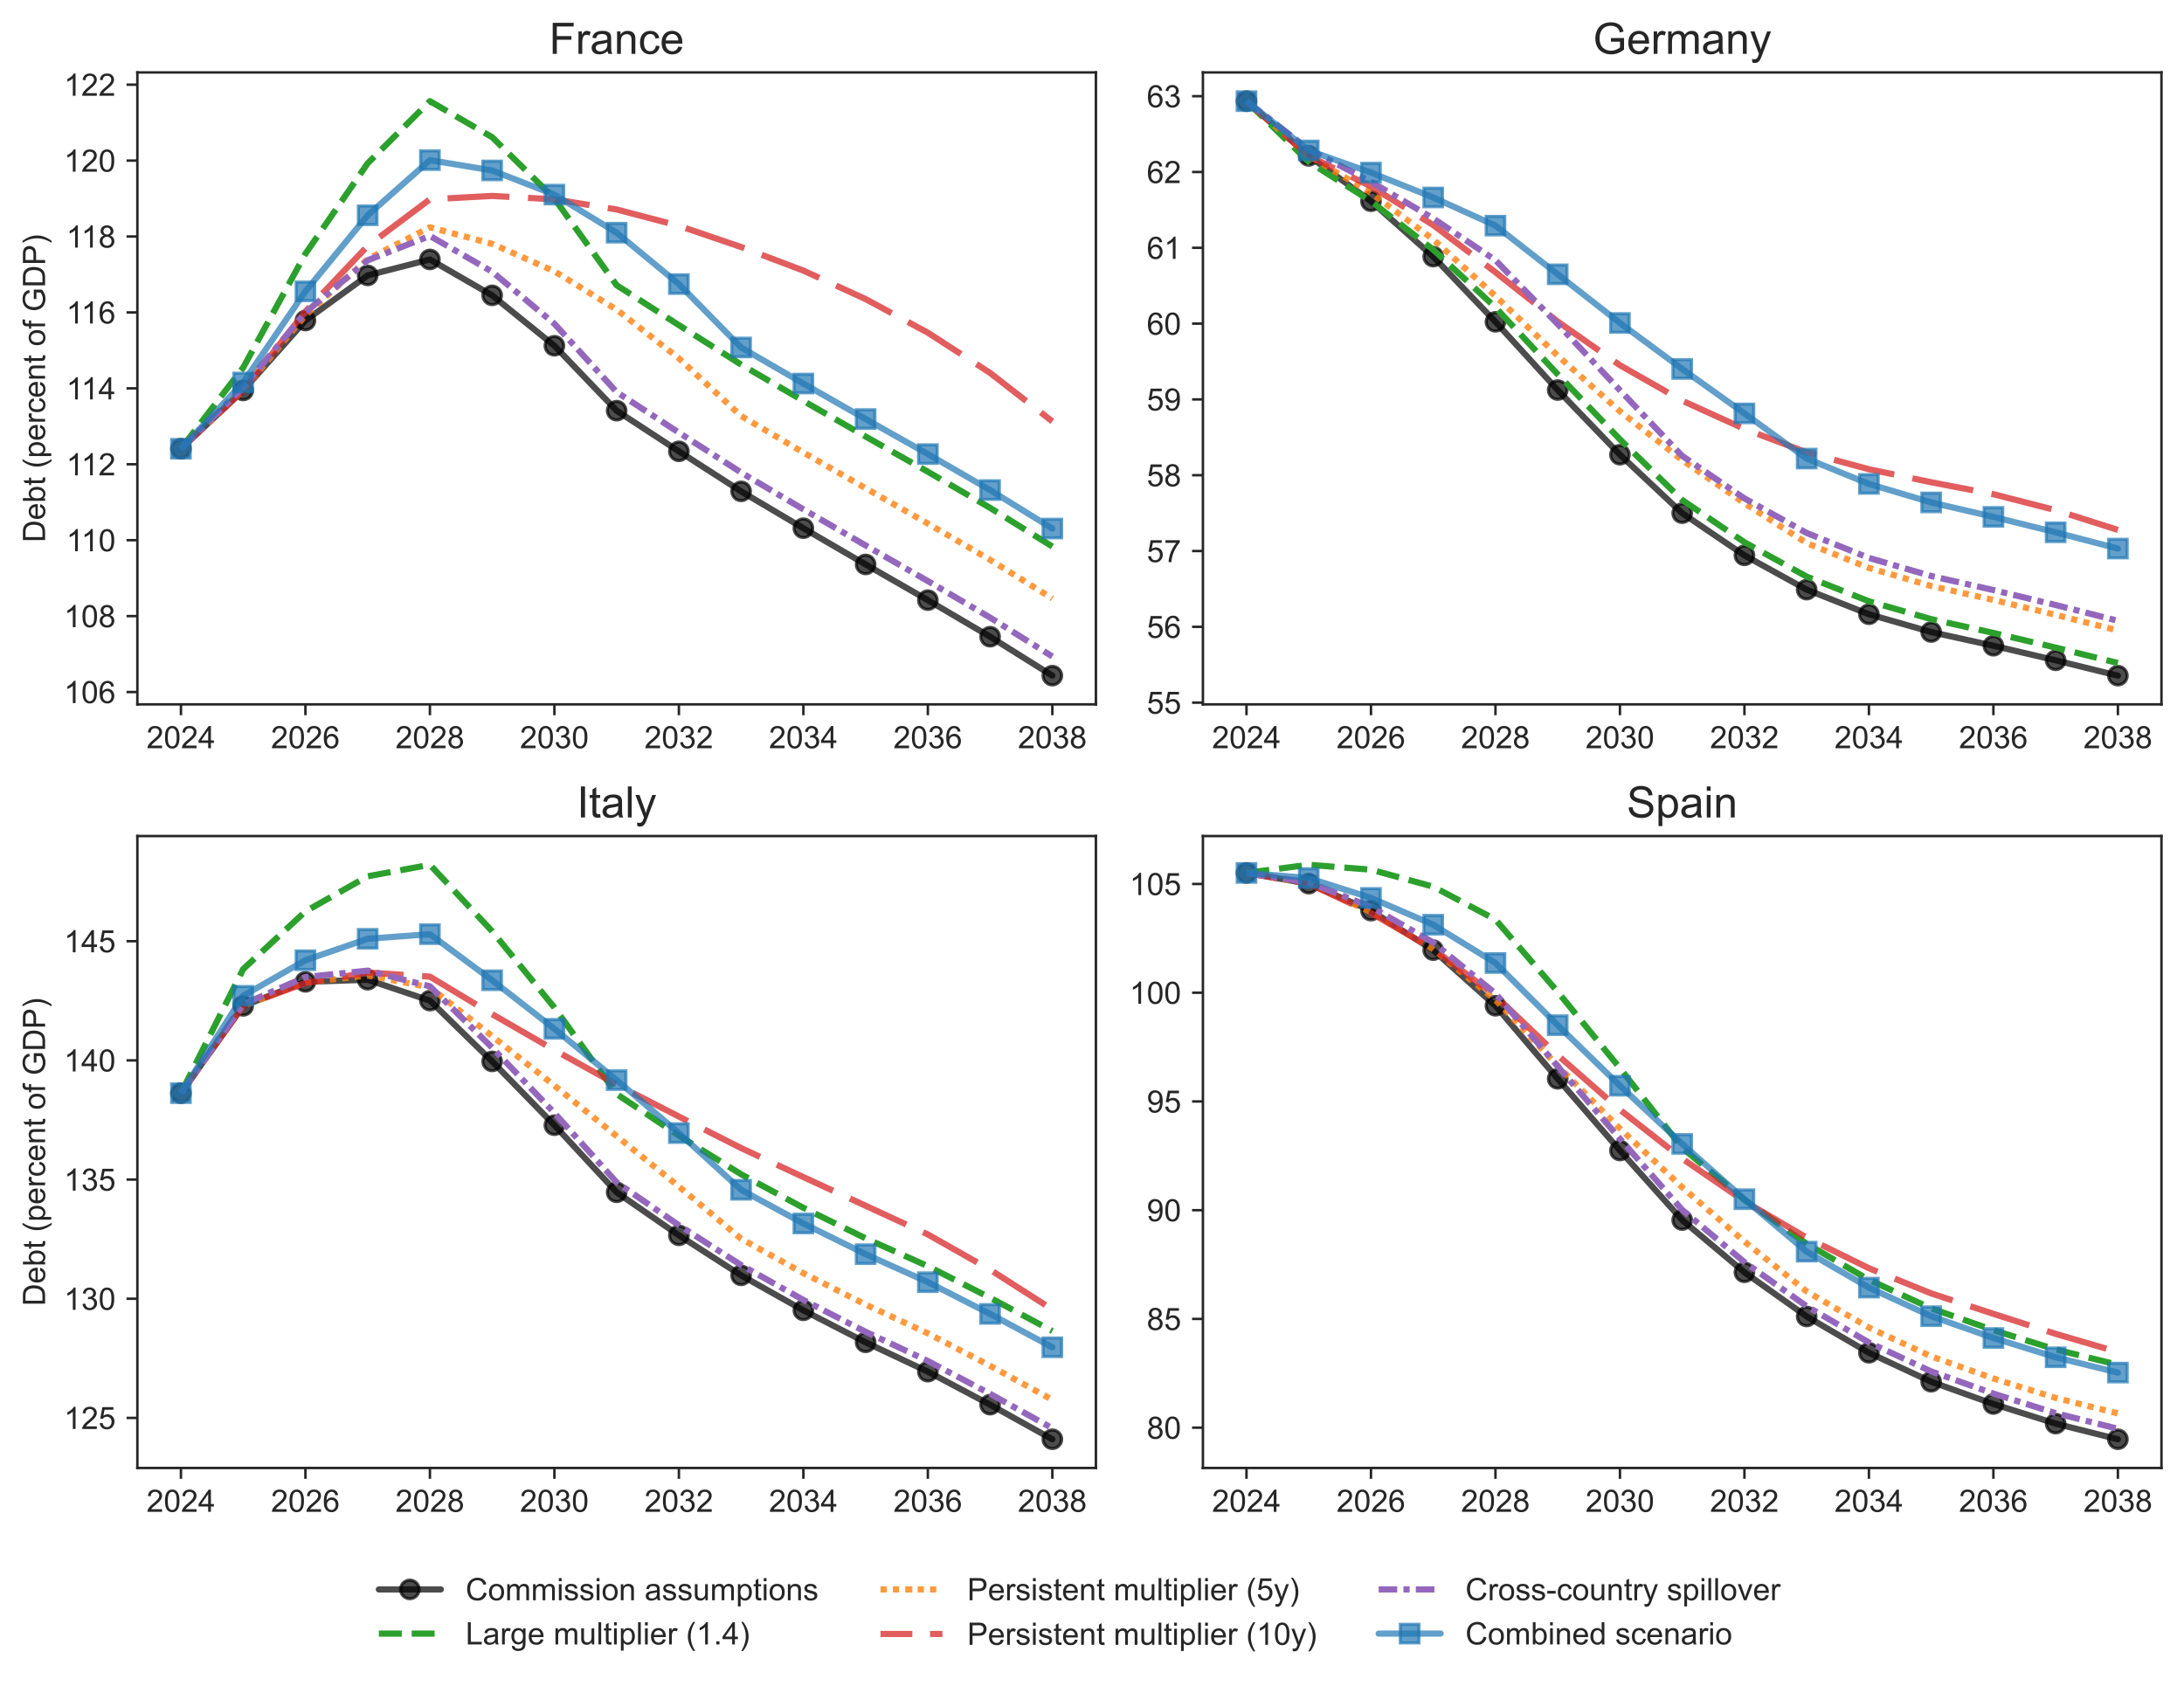
Source: Welslau (2024), European Commission May 2024 forecast; own calculations.
Note: Baseline methodology based on European Commission (2024a) and requirements of the reformed fiscal framework. The large multiplier scenario increases the size of the contemporaneous fiscal multiplier from 0.75 to 1.4. The persistent multiplier scenarios assume linear phase out of contemporaneous multiplier effects over 5 or 10 years instead of the 3-year baseline. The cross-country spillover scenario assumes that consolidation affects trading partner’s real GDP proportional to GDP weighted export shares. The combined scenario features a 0.9 fiscal multiplier, 5-year persistence, and cross-country spillovers
4. Conclusions
Reformed EU fiscal rules will have a major impact on the fiscal policy stance in EU member states, with potentially negative implications for economic growth. Debt Sustainability Analysis (DSA) plays a pivotal role, as it serves as the key analytical tool to calculate how much fiscal adjustment is required to keep the public debt ratio on a plausibly downward trajectory (or at ‘prudent’ levels). This paper contributes by providing a quantitative assessment of key assumptions in the underlying DSA framework.
We have shown that the European Commission’s DSA projections for real GDP levels and public debt ratios are sensitive to the assumptions of how fiscal consolidation affects economic growth. We have presented simulations under different scenarios, in which we vary the short-run fiscal multiplier, assume a slower dissipation of negative output effects, and introduce cross-country spillovers that make fiscal adjustment by trading partners spill over into domestic economic activity. Our results suggest that the EC’s baseline adjustment scenario may be too optimistic: under realistic alternative DSA assumptions of how fiscal adjustment affects growth, real GDP levels turn out significantly lower, so that public debt ratios do not fall as expected by the European Commission. Although public debt ratios do decline in the medium-run, Germany, France, Italy and Spain could face public debt levels that are, on average, 3.1 percentage points of GDP higher at the end of the projection horizon (2038) than under the EC’s assumptions.
What are the policy implications? The large euro area countries with high public debt ratios France, Italy and Spain– which will have to adjust significantly more than their EU peers – may experience more adverse domestic growth effects than currently expected. In particular, this will be the case if average fiscal multipliers turn out larger and/or if the negative short-run growth effects from fiscal adjustment dissipate more slowly than assumed by the European Commission. Although a level shift in public debt ratios need not endanger debt sustainability in the medium run, economic stagnation and a larger than expected increase in public debt ratios in the short run may erode the confidence of voters and bond investors. Should cross-country spillovers materialise, Germany and other EU countries with strong intra-EU trade links will experience lower growth due to the restrictive fiscal policy stance by important trading partners. Compensating for the drag on growth due to lower import demand from EU trading partners may not be an easy task in the current environment.
Our simulations suggest that pursuing public debt reduction across the EU’s member states by going for simultaneous fiscal consolidation could prove counterproductive in the short run if the negative growth effects of simultaneous adjustments are underestimated. The end result could be significantly higher public debt ratios than expected and growing divergence between EU member states.
References
- Alloza, M., Burriel, P., Pérez, J. (2019): Fiscal policies in the euro area: Revisiting the size of spillovers, Journal of Macroeconomics, 61, 103132
- Auclert, A., Rognlie, M., Straub, L. (2024): The Intertemporal Keynesian Cross, Journal of Political Economy (forthcoming).
- Auerbach, A., Gorodnichenko, Y. (2012): Measuring the output responses to fiscal policy, American Economic Journal: Economic Policy, 4(2), 1-27.
- Batini, N., Eyraud, L., Forni, L., Weber, A. (2014): Fiscal multipliers: size, determinants, and use in macroeconomic projections, IMF Technical Notes and Manuals, September 2014.
- Blanchard, O., Leandro, A., Zettelmeyer, J. (2021): Redesigning EU fiscal rules: from rules to standards, Economic Policy, 36(106), 195-236.
- Bonam, D., de Haan, J., Soederhuizen, B. (2022): The effects of fiscal policy at the effective lower bound, Macroeconomic Dynamics, 26(1), 149-185.
- Buti, M., Giudice, G. (2002): Maastricht’s fiscal rules at ten: an assessment, Journal of Common Market Studies, 40(5), 823-848.
- Caldara, D., Kamps, C. (2017): The Analytics of SVARs: A Unified Framework to Measure Fiscal Multipliers, Review of Economic Studies, 84 (3), 1015–1040.
- Canzeroni, M., Collard, F., Dellas, H., Diba, B. (2016): Fiscal multipliers in recessions, Economic Journal, 126(590), 75-108.
- Carnot, N., de Castro, F. (2015): The discretionary fiscal effort: an assessment of fiscal policy and its output effect, European Economy – Economic Papers No. 543.
- Darvas, Z., Welslau, L., Zettelmeyer, J. (2023): A quantitative evaluation of the European Commission’s fiscal governance proposal, Bruegel Working Paper 16/2023.
- Darvas, Z., Welslau, L., Zettelmeyer, J. (2024): The implications of the European Union’s new fiscal rules, Bruegel Policy Brief (June 20th 2024).
- DeLong, B., Summers, L. (2012): Fiscal policy in a depressed economy, Brookings Papers on Economic Activity, 43(1), 233-274.
- European Commission (2016): Towards a positive fiscal stance for the euro area, Communication from the Commission, COM(2016) 727 final.
- European Commission (2022): Fiscal sustainability report 2021, European Economy – Institutional Paper No. 171.
- European Commission (2024a): Debt Sustainability Monitor 2023, Institutional Paper No. 271.
- European Commission (2024b): 2024 Ageing Report, forthcoming.
- EU Regulation (2024): Regulation (EU) 2024/1263: Regulation EU (2024) of the European Parliament and of the Council of 29 April 2024 on the effective coordination of economic policies and on multilateral budgetary surveillance and repealing Council Regulation (EC) No 1466/97, Document 32024R1263.
- Fatas, A. (2019): Fiscal policy, potential output, and the shifting goalposts, IMF Economic Review, 67(3), 684-702.
- Gechert, S. (2015): What fiscal policy is most effective? A meta-analysis, Oxford Economic Papers, 67(3), 553-580.
- Gechert, S., Hughes Hallett, A., Rannenberg, A. (2016), Fiscal multipliers in downturns and the effects of Eurozone consolidation, Applied Economics Letters 23(16), 1138-1140.
- Gechert, S., Rannenberg, A. (2018): Which fiscal multipliers are regime-dependent? A meta-regression analysis, Journal of Economic Surveys, 32(4), 1160-1182.
- Goujard, A. (2017): Cross-country spillovers from fiscal consolidations, 38(2), 219-267.
- Guzman, M. (2016): Definitional issues in the IMF debt sustainability analysis framework: a proposal, CIGI Policy Brief No. 77.
- Heimberger, P. (2017): Did fiscal consolidation cause the double-dip recession in the euro area?, Review of Keynesian Economics, 5(3), 539-558.
- Heimberger, P., Huber, J., Kapeller, J. (2020): The power of economic models: The case of the EU’s fiscal regulation framework, Socio-Economic Review, 18(2), 337-366.
- Heimberger, P. (2023): Debt sustainability analysis as an anchor in EU fiscal rules: an assessment of the European Commission’s reform orientations, in-depth analysis requested by the ECON committee of the European Parliament, March 2023.
- Iltzetzki, E., Mendoza, E., Vegh, C. (2013): How big (small?) are fiscal multipliers?, Journal of Monetary Economics, 60(2), 239-254.
- Ilori, A.E., Paez-Farrell, J., Thoenissen, C. (2022): Fiscal policy shocks and international spillovers, European Economic Review, 141(1), 103969.
- In ‘t Veld, J. (2013): Fiscal consolidations and spillovers in the euro area periphery and core, European Economy – Economic Papers No. 506.
- Jarocinski, M., Lenza, M. (2018): An inflation-predicting measure of the output gap in the euro area, Journal of Money, Credit and Banking, 50(6), 1189-1224.
- Jorda, O., Taylor, A. (2016): The time for austerity: estimating the average treatment effect of fiscal policy, Economic Journal, 126(590), 219-255.
- Karras, G. (2012): Trade openness and the effectiveness of fiscal policy: some empirical evidence, International Review of Economics, 59(3), 303-313.
- Leeper, E., Traum, N., Walker, T. (2017): Clearing up the fiscal multiplier morass, American Economic Review, 107(8), 2409-2454.
- Mc Morrow, K., Roeger, W., Vandermeulen, V. (2017): Evaluating Medium Term Forecasting Methods & their Implications for EU Output Gap Calculations, European Economy Discussion Paper, No. 070.
- McKay, A., Nakamura, E., Steinsson, J. (2016): The Power of Forward Guidance Revisited, American Economic Review, 106 (10), 3133–3158.
- Poghosyan, T. (2020): Cross-country spillovers of fiscal consolidations in the euro area, International Finance, 23(1), 18-46.
- Ramey, V. (2019): Ten years after the financial crisis: what have we learned from the renaissance in fiscal research?, Journal of Economic Perspectives, 33(2), 89-114.
- Welslau, L. (2024): EU-Debt-Sustainability-Analysis, Replication of the European Commission’s DSA in Python, https://github.com/lennardwelslau/eu-debt-sustainability-analysis/ [last version based on the June 2024 update]
- Woodford, M. (2011): Simply analytics of the government spending multiplier, American Economic Journal: Macroeconomics, 3(1), 1-35.
- Wyplosz, C. (2011): Debt sustainability assessments: mission impossible, Review of Economics and Institutions, 2(3), 1-37.